Part 1:
Introduction:
Crime and poverty is always at a topic of interest for many policy makers. A particular town was included in a study on crime rates and poverty. The towns news station stated that crime increases as the number of kids who get free lunches increases, according to a particular data source. This is a strong claim from the news station, which deserves a further glance at the data. To see if this claim is correct, SPSS will be used to complete a regression to observe whether there actually is a relationship between the number of kids who receive free lunch and crime rates.
Methods:
To determine whether there is relationship between the independent variable (free lunches) and the dependent variable (crime rates), the data provided in an Excel document was used to create a scatter plot and OLS line (Figure 1). After that, the same data was uploaded into SPSS and a linear regression analysis was used to show the linear relationship between each variable (Figure 2). This analysis is important because it displays the regression coefficient (b) that explains how responsive the dependent variable is to change in the independent variable. More simplistically, it gives the direction of the relationship between each variable. Additionally, the analysis provides the coefficient of determination ( r2) which represents how the independent variable explains the dependent variable.
 |
| Figure 1: Scatter Plot Between Independent and Dependent Variables |
 | ||||||||||||||||
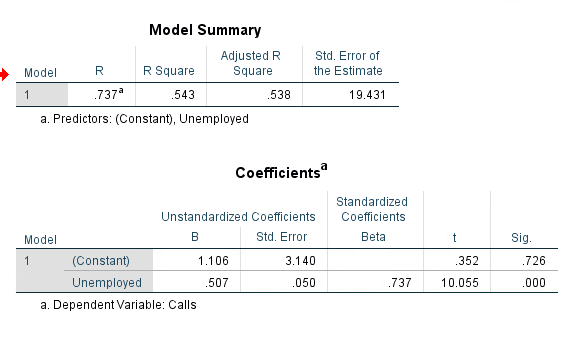
| Figure 2: Linear Regression Analysis
Results:
By looking at the scatter plot and trend line, it is clear there is a somewhat positive relationship between the percentage of kids getting free lunch and crime rates. This relationships can be confirmed by looking at the regression coefficient (0.173) which shows the positive slope. Because .173 is significantly closer to 0 that it is to 1, this means that the relationship between the two variables is weak. It is also important to pay attention to the significance level: 0.005 (two-tailed test). This means that in relation to the hypothesis test of this analysis, the null hypothesis would be rejected because there is a relationship between the independent and dependent variables. If a new area of town turned out to have 30% of the kids having free lunch, the crime rate would then be 72.38. To determine this result the trend line equation was used: y=1.6852x+21.819 with 30 going in as 'x'. Although these variables show an existing relationship, it wouldn't be best to base assumptions off of these results due to the weak regression coefficient.
Conclusion:
According to the results from the scatter plot and the linear regression analysis, the local news station was correct in saying that there was a positive relationship between the percentage of kids that receive free lunch and crime rates. However, the relationship between both variables is very weak which means that there might be other factors that effect each of these variables more than each other. To tie these variables together without knowing the cause would be misleading. Correlation does not imply causation. This variables should be examined individually before the news station shares this information with the town.
Part 2:
Introduction:
The city of Portland, Oregon is worried about whether the responses to 911 calls are sufficient. For better understanding, different factors will be looked at to help determine what areas most of the calls are coming from. This information will be useful to a company that wants to construct a new hospital so they can know where to place the ER and how big to build it. By analyzing which areas most of the 911 calls are coming from, the most accurate area of placement can be determined for the proposed hospital.
Methods:
To start, data featuring number of 911 calls per census tract, number of people with no high school degree, number of people unemployed, and the number of people who were foreign born were created into three different scatter plots in Excel (Figure 3,4,5,6,7,8). The number of calls always being the dependent variable, and the other three variables representing the independent variables. Next, using SPSS, using calls as the dependent variable again and the other three as independent variables, a linear regression analysis was performed for each of the three combinations of data. After that, ArcGIS was used to create a choropleth map to show the number of 911 calls per Census Tract (Figure 9). Also, an additional standardized residual map was created to display the variable with the largest r2 value (Figure 10). This map essentially shows the standard deviation of the residuals or the amount of deviation from the regression line. All of this information will aid in testing the hypothesis. The null hypothesis: there is no linear relationship between the number of 911 calls and the number of people with no high school degree, number of people unemployed, and the foreign born population. The alternative hypothesis: there is a linear relationship between the number of 911 calls and the number of people with no high school degree, number of people unemployed, and the foreign born population
Results:
Looking at Figure 3 & 4, there is a positive slope represented from the trend line. The regression coefficient of 0.567 also shows positive slope and a fair strength between the variables. The significance level is at 0.000 meaning that there is a significant linear relationship between 911 calls and the number of people with no high school degree. This means that we can reject the null hypothesis. The equation y=0.166x+3.931 tells us that every person without a high school degree, means that there is a 0.166 increase of 911 calls.
Looking at Figure 5 & 6, there is a positive slope represented from the trend line. The regression coefficient of 0.543 also shows a positive slope and a fair strength between the variables. The significance level is once again at 0.000 meaning there is a significant linear relationship between 911 calls and the number of people who are unemployed. This means that we can reject the null hypothesis. The equation y=0.507x+1.106 tells us that each person who is unemployed, increases the number of 911 calls by 0.507.
Looking at Figure 7 & 8, there is a positive slope represented from the trend line. The regression coefficient of 0.552 also shows a positive slope and a fair strength between the variables. The significance level is once again at 0.000 meaning there is a significant linear relationship between 911 calls and the number of people who were foreign born. This means that we can reject the null hypothesis. The equation y=0.080x+3.043 tells us that each person who was foreign born, increases the number of 911 calls by 0.080.
Figure 9 displays the choropleth map of the number of 911 calls per census tract in Portland, OR. The darkest blue tracts represent the highest numbers of 911 calls and then ranges down to the lightest blue representing very few calls. It looks like the most calls are coming from the census tracts located in the upper middle of Portland. The independent variable that had the highest r2 value turned out to be number of people with no high school degree. Figure 10 shows data that represents the number of 911 calls and the the number of people with no high school degree per census tract. Standard deviation helps to show which census tracts fell above or below the regression line. Red meaning above and blue meaning below. This means that these areas have higher or lower calls than the regression line predicted. When comparing Figure 9 and Figure 10, the two dark red census tracts on Figure 10 are also shown as dark blue on Figure. This makes sense considering both maps show significant number of 911 calls coming from those census tracts.
Conclusion:
On Figure 10, two census tracts are highlighted in between two other census tracts that were over 2.5 standard deviations. The two highlighted tracts were chosen because they are directly located between the two census tracts with high 911 calls. This would a good area for a potential hospital. Although it would be located in an area that doesn't have the highest calls, it would directly between two areas that do have high calls so that the people in need of an ER will be equally close respectively from both sides. Although the independent variable that had the highest r2 value turned out to be number of people with no high school degree, the other two variables had very similar r2 values as well and should also be considered when examining locations to put potential hospitals.
|


No comments:
Post a Comment